|
Using standard normal tables.
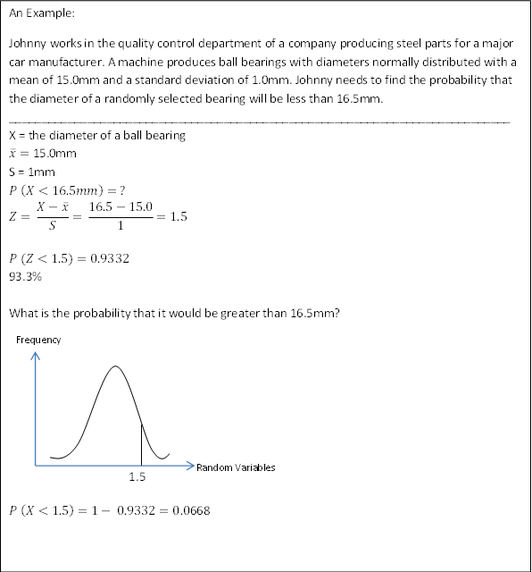
The random variable X is usually standardized so that the mean is zero and the standard deviation is 1. The standardized normal variable is called Z so the expression for the distribution becomes: Z~N(0,1) The random variable X is converted to Z by the formula: 
|
Worked Example:
|
Sampling
The word population is used to describe the entire set of individuals, items or data values for from which a statistical sample can be taken. The population can be large or small, and could be any object under investigation.
Examples:
o Blood cells taken from patients
o A culture of Bacteria
o People supporting a political party
Some investigations require you to consider the entire population; other investigations require a sample of that population.
Example: The population could be all the patients who were admitted to the Accident and Emergency department over a particular weekend , whereas a sample could comprise 50 patients randomly selected from the population of all the patients.
Note that the larger the sample is, the more representative of all the population it will be, and the more reliable any conclusions drawn from the statistical analysis will be.
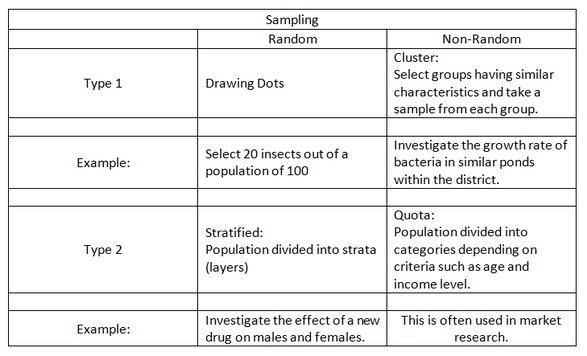
Sampling --> Random or Non-random
The word population is used to describe the entire set of individuals, items or data values for from which a statistical sample can be taken. The population can be large or small, and could be any object under investigation.
Examples:
o Blood cells taken from patients
o A culture of Bacteria
o People supporting a political party
Some investigations require you to consider the entire population; other investigations require a sample of that population.
Example: The population could be all the patients who were admitted to the Accident and Emergency department over a particular weekend , whereas a sample could comprise 50 patients randomly selected from the population of all the patients.
Note that the larger the sample is, the more representative of all the population it will be, and the more reliable any conclusions drawn from the statistical analysis will be.
Sampling --> Random or Non-random
Standard Error and confidence limits.
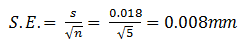
As the mean and standard deviation are estimates of a population, there will be a sampling error. The standard error (S.E.) of the mean is given by:
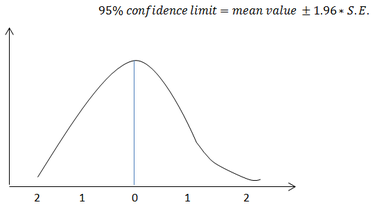
You need to give a figure of confidence to your data; this is described by the confidence limits, which are related to the standard error. For normally, distributed data, 95% of data falls within two standard deviations of the mean. The 95% confidence level is therefore adequate for most scientific studies.
Based on standard normal tables:
As the mean and standard deviation are estimates of a population, there will be a sampling error. The standard error (S.E.) of the mean is given by:
You need to give a figure of confidence to your data; this is described by the confidence limits, which are related to the standard error. For normally, distributed data, 95% of data falls within two standard deviations of the mean. The 95% confidence level is therefore adequate for most scientific studies.
Based on standard normal tables:
Problem
The mean of five values is 2.36mm and the standard deviation is 0.018mm.
a) What is the standard error of the mean?
b) What is the 95% confidence limits, assuming the data are normally distributed.
95% confidence limits
Lower limit: (mean – 1.96 S.E.) = 2.344mm
Upper Limit: (mean + 1.96 S.E.)= 2.376mm
Bellow One can find Step by step instructions on how to perform the Chi-squared test. This is a statistical analysis tool which can also be done using Excel and other statistical tools.
