Collection of data
Unit 6: Using mathematical Tools in Science
Collection of data
Methods of Data Collection:
Data collection means gathering information to address those critical questions that you have identified earlier in the evaluation process. There are many methods available to gather information.
The most important issue in the data collection process is selecting he most appropriate information or evidence to answer your questions. To plan data collection, you must think about the questions to be answered and the information sources available. Also you must think ahead about how the information could be organized, analyzed, interpreted and then reported to various audiences.
There are multiple ways to collect information to answer most questions. The ideal situation would be to collect from more than one source and/or to collect more than one type of information. The selection of the method must balance several concerns including:
- Resources available
- Credibility
- Analysis and reporting resources
- Skill
Examples:
· Behavior observation Checklist (a list of Actions among participants being observed).
· The opinion Survey (an assessment of how a person or a group feels about a particular issue).
· The performing test (an example would be VRT. Testing the ability to perform a particular skill).
· Questionnaire (a group of questions that people respond to verbally or in writing).
· Time Series (Measuring a single variable constantly over time).
· Case Study (Experiences and characteristics of selected persons involved within a project).
· Individual Interview (Individual’s responses, opinions and views are viewed).
· Log taking / Journals (In a log we are interested in a persons behavior and reactions as a narrative).
Issues to Consider:
- Availability
- Bias
- Reliability
- Validity
The recording of Data:
Manual recording ---> Data labels ---> Short term process.
Automatic Recording ---> Data logger ---> Long term process.
(Find some information about data loggers – What is a data logger? / What it is used for? / Why is it used? / Advantages and disadvantages of data loggers.)
Collection of data (cont.)
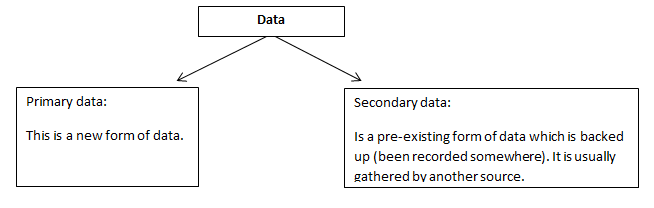
Advantages of Secondary Data:
- Easier to gather than primary data.
- It is already collected and so readily available.
Disadvantages of Secondary Data:
- Is the data suitable?
- Cost and access, is made difficult through membership.
- Validity of data.
- Reliability of data.
Advantages of Primary Data:
- Data was never gathered before (more prestigious).
- Find data that suits your purpose.
Disadvantages of Primary Data:
- Costly and time consuming.
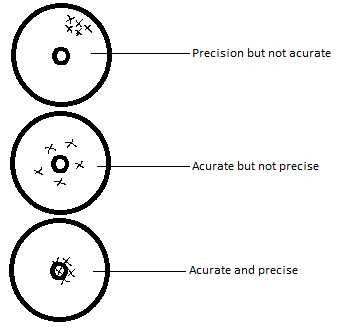
Errors in Experimental Work
Accuracy is the degree to which information on a map matches true or expected value. Precision refers to the level of measurement and exactness of description.
The absolute error:
Absolute error by definition is the amount of physical error in a measurement
E absolute = [X measured – X accepted]
The two lines mean that no matter what the answer should be positive due to the modulus sign.
Example: If you know a length is 3.535 ± 0.004, then 0.004 is the absolute error.
The Relative Error:
The relative error by definition is the ratio of the absolute error of the measurement to the accepted measurement in relation to the measurement itself.
Relative Error = Measured value – Actual value / Actual value
The percentage error:
The percentage error = Relative error X 100%
